Blog Post
How Real-Time Project Dashboards Improve Decision-Making
July 7, 2026
Table Of Content
Introduction
You launch a project with a clear plan. Three weeks in, a deadline slips. A budget line creeps over. Nobody noticed until the weekly status report landed on a Friday afternoon.
Real-time project dashboards solve exactly this problem. Project Flow Insights helps teams replace delayed reporting with live, visual data that tells you what's happening right now — not what happened last week.
A real-time project dashboard is a live visual interface that consolidates key project metrics, timelines, budgets, and risks into a single view that updates automatically as data changes.
In this article, you'll learn how these dashboards reduce decision-making delays, which metrics matter most, and how to pick the right features for your team's needs.
Quick Answer
A real-time project dashboard gives your team instant access to live project data. It shows progress, budget, risks, and resource use in one place. Decisions happen faster because you're working with facts, not memory. Teams that use dashboards catch problems earlier and fix them before they grow.
What Is a Real-Time Project Dashboard?
A real-time project dashboard is a visual command center that consolidates key performance indicators (KPIs) and project metrics into a single live interface. It gives decision-makers an up-to-date view of project health, resource allocation, timeline progress, and risk alerts — updated automatically from connected data sources.
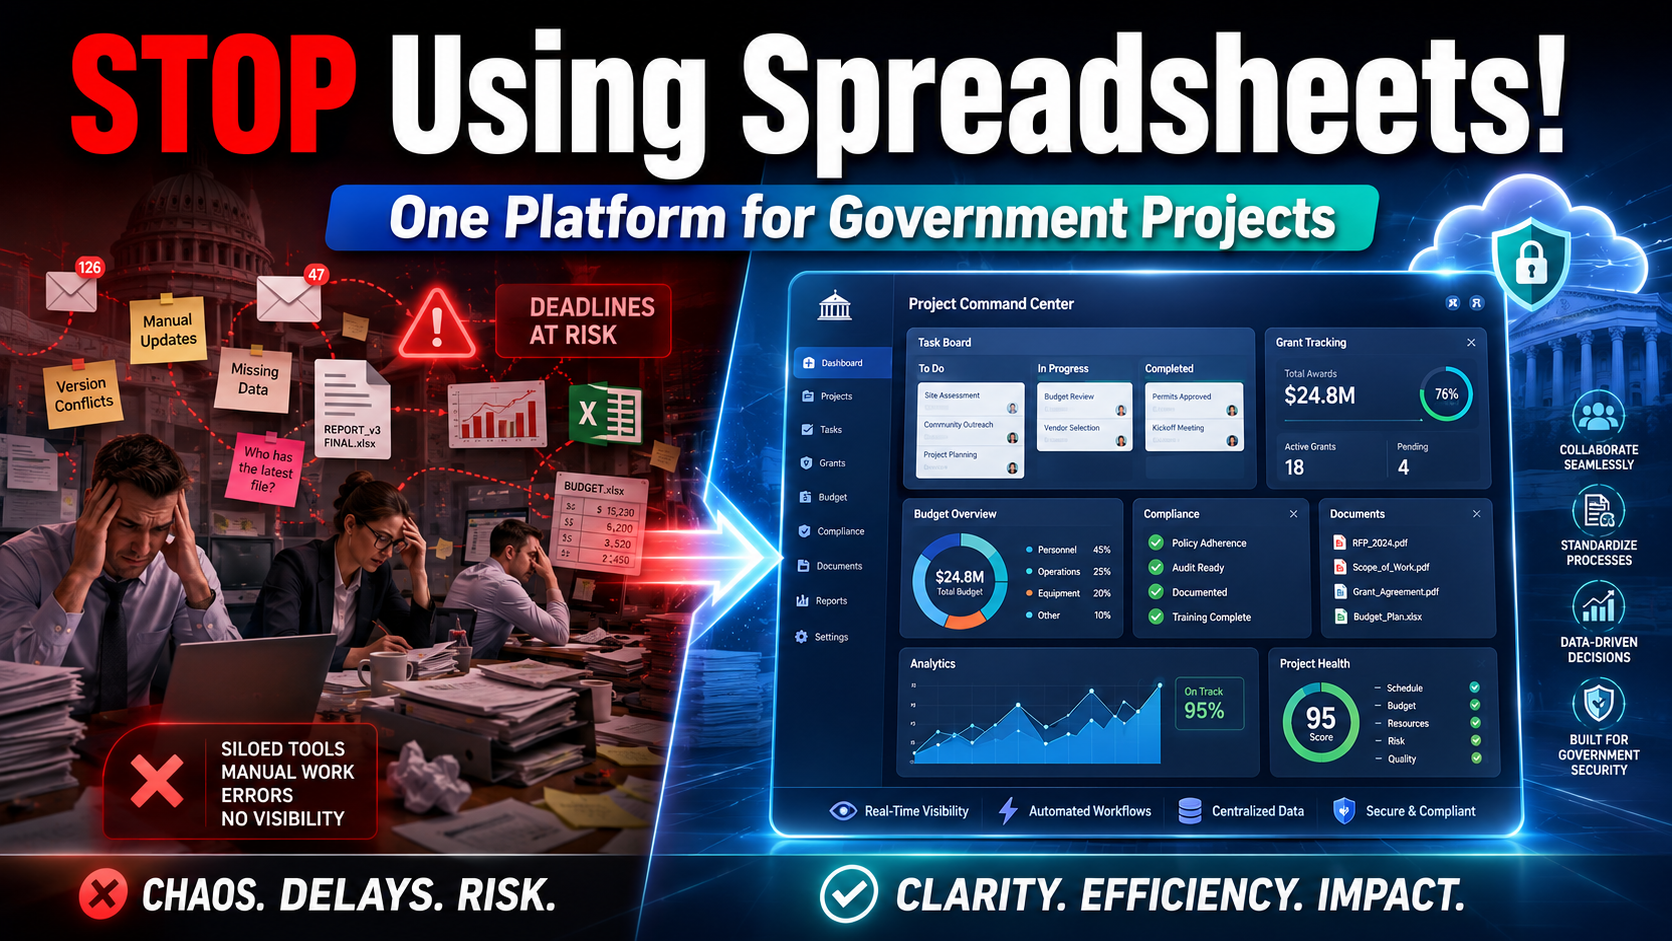
Unlike static spreadsheets or weekly reports, a real-time dashboard pulls data from task tracking systems, financial tools, and communication platforms simultaneously. The result is one accurate, shared source of truth that every stakeholder can access at any time.
Traditional reporting methods — like manual spreadsheet updates — fail for three key reasons: information goes stale quickly, task progress is scattered across systems, and team members struggle to filter what's relevant, which slows down interpretation and action.
Why Do Teams Still Struggle Without Real-Time Visibility?
The gap between what leaders think is happening and what's actually happening costs organizations enormously. Many teams still rely on manual status updates, which introduces dangerous delays.
According to Wellingtone's State of Project Management Report, 47% of project professionals say they do not have access to real-time project KPIs, and 50% spend one day or more each month manually collating project status information.
That means roughly half of all project management time spent on reporting could be automated — and redirected toward strategic work.
According to the Project Management Institute (PMI), organizations lose about 11.4% of their total project investment due to poor project performance. When visibility is delayed, risks compound undetected.
How Do Real-Time Dashboards Improve Decision-Making?
Real-time dashboards accelerate and improve decisions by replacing gut instinct with immediate, evidence-based insight. When a project manager can see budget variance, task completion rates, and team workload in a single view, they respond in minutes — not days.
Project management dashboards make it significantly easier to move from intuition-based decisions to data-driven ones, helping teams shift from reacting to issues after the fact to proactively identifying risks by monitoring trends in real time.
The three most measurable decision improvements dashboards deliver are:
Speed:
Decisions happen in the moment, not after end-of-week reports arrive.
Accuracy:
Data comes directly from integrated systems, reducing human error.
Alignment:
All stakeholders view the same metrics, eliminating version confusion.
What Metrics Should Your Project Dashboard Track?
The most effective dashboards track metrics that directly map to your project's success criteria. Overloading a dashboard with data causes analysis paralysis — the opposite of fast decision-making.
Here are the five core metric categories every real-time project dashboard should include:
Schedule progress:
Percentage of tasks completed vs. planned, milestone tracking, and burndown charts
Budget utilization:
Actual spend vs. forecast, cost variance, and daily expenditure
Resource allocation:
Workload per team member, utilization rates, and capacity flags
Risk indicators:
Issues flagged, blockers outstanding, and items past due
Quality signals:
Defect rates, rework volume, and stakeholder approval status
The main purpose of a daily dashboard is to enhance visibility by bringing together information from multiple systems and data sources, summarizing the most important details that impact project outcomes.
Real-Time vs. Static Reports: A Direct Comparison
| Feature | Static Reports | Real-Time Dashboards |
| Data freshness | Hours to days old | Updated every few seconds |
| Format | PDF or email | Interactive visual interface |
| Drill-down capability | None | Full — from summary to task level |
| Automated alerts | Not available | Triggered by threshold breaches |
| Stakeholder access | Recipient-only | Shared, role-based access |
| Decision speed | Days after report | Immediate |
| Integration with tools | Manual data entry | Automatic API-based sync |
| Typical cost tier | Low (spreadsheets) | Mid to high (PM software) |
Real-time dashboards are interactive visualizations of project data that include dynamic live data feeds updating every few seconds, pulling from task tracking and financial systems, with drill-down capabilities allowing navigation from high-level summaries to detailed task data to help uncover root causes of issues.
Ready to move from static reports to live decision-making? Explore Project Flow Insights' dashboard setup guides to get your team aligned within 48 hours.
Can Real-Time Dashboards Actually Rescue Failing Projects?
Research on real project turnarounds provides a strong answer: yes. Organizations that introduced well-designed dashboards at critical project inflection points showed measurable improvements in outcomes.
The improvement in rescued projects is attributed to enhanced transparency, faster problem detection, and increased executive empowerment to make informed decisions on changes — such as reallocating resources and escalating issues before they become critical failures.
According to PMI's research, AI high adopters using integrated dashboards report major gains: 91% in quality, 87% in scope, 86% in cost, and 85% in schedule performance.
The pattern is consistent: when teams see problems earlier, they fix them for less.
How Does a Real-Time Dashboard Align Cross-Functional Teams?
One of the most underrated benefits of real-time dashboards is their ability to unite teams that rarely share data.
Developers, finance, QA, and executives often operate from different tools and different versions of the truth. A centralized dashboard creates one shared reality that every role can access simultaneously.
Dashboards become a shared source of truth, aligning teams, stakeholders, and even clients around the same data and progress — enabling more informed decisions, reduced miscommunication, and stronger alignment on priorities and outcomes.
Organizations are placing higher value on being able to access and analyze data instantly, with this trend driven by the need for agility and the ability to adapt to rapidly changing circumstances.
What Are the Key Trends Shaping Project Dashboards in 2025 and 2026?
Project dashboards are evolving rapidly. The shift from passive reporting to predictive, AI-integrated tools is the defining trend of this period.
By 2026, 80% of Project Management Offices (PMOs) are expected to use AI for decision-making, according to PM Study Circle research.
The project management software market was valued at USD 7.36 billion in 2023 and is projected to reach USD 15.06 billion by 2032, with a CAGR of 18.48%, according to Straits Research — reflecting widespread global adoption of digital project tools.
The most significant dashboard trends to act on right now:
Predictive analytics:
Dashboards that flag risks before they occur using historical patterns
AI-generated summaries:
Automatic plain-language explanations of what metrics mean
Mobile-first access:
Real-time data available on phones for field teams and traveling executives
Embedded collaboration:
Comments, approvals, and decisions made directly inside the dashboard
Closing Thoughts
The real competitive advantage isn't just having data — it's acting on it faster than your rivals do. When your team can see a risk emerge at 10 a.m. and resolve it by noon, your project doesn't become another cautionary statistic. Every week you spend waiting on manual reports is a week your most important problems go unresolved.
Your next project deserves better visibility. Start building your first real-time dashboard with ProjectFlow Insights
Frequently Asked Questions
What is a real-time project dashboard?
A real-time project dashboard is a visual tool that pulls live data from your project management systems and displays it as charts, graphs, and KPIs. It updates automatically, giving your team an instant and accurate view of project health, budget status, timelines, and risks without manual reporting.
How do real-time dashboards help project managers make better decisions?
Dashboards replace delayed status reports with live data, allowing project managers to spot bottlenecks, budget overruns, and scheduling issues the moment they appear. According to Wellingtone (2024), 50% of project managers currently spend a full day each month on manual reporting — dashboards eliminate that delay entirely.
What metrics should a project dashboard display?
The most critical metrics include schedule progress, budget utilization, resource allocation, risk flags, and quality indicators. The best dashboards allow you to drill down from a high-level portfolio view to individual task level, giving managers full context for every decision.
Can a dashboard prevent project failure?
Dashboards significantly reduce failure risk by surfacing problems early. PMI research (2025) shows that only 35% of projects worldwide finish successfully on time and within budget. Teams using real-time dashboards detect delays and cost overruns earlier, giving them time to course-correct before failure becomes inevitable.
What is the difference between a static report and a real-time dashboard?
A static report shows historical data — what happened in the past reporting period. A real-time dashboard shows current data, updated continuously from live sources. The key difference is decision speed: static reports lead to decisions made days later; dashboards enable decisions made in the moment.
How long does it take to set up a real-time project dashboard?
Setup time varies by tool and complexity. Most cloud-based project management platforms offer dashboard templates that can be configured within hours. Custom dashboards connecting multiple data sources may require one to two weeks of integration work. Simpler tools like Monday.com, Asana, or ClickUp offer pre-built dashboards ready on day one.
Do small teams need real-time dashboards?
Yes. Even teams of two or three benefit from a shared live view of task progress and deadlines. Small teams often lack the bandwidth for manual reporting, making automation more valuable — not less. Many platforms offer free or low-cost dashboard tiers suitable for small teams.
What is the best project dashboard software?
The best tool depends on your team's size, methodology, and integration needs. Leading options include Microsoft Project, Monday.com, Asana, ClickUp, Wrike, and Jira. Each offers real-time dashboards with varying levels of customization. Prioritize tools that integrate with your existing stack.
How do dashboards support remote and hybrid project teams?
Dashboards give distributed teams a single shared source of truth regardless of location. Remote team members can view the same live data as in-office colleagues, reducing the communication gaps that often cause delays. PMI data confirms that remote teams perform as well as in-person ones when leaders equip them with the right collaboration tools.
What should I look for in a project dashboard for executives?
Executive dashboards should show portfolio-level health, not task-level detail. Key elements include: overall project status indicators (green/amber/red), budget vs. actual spend across all active projects, milestone completion rates, and risk summaries. The goal is to give leaders the insight to make strategic calls in under two minutes of review.